

Picture a quiet morning kitchen. Someone pours hot water from a kettle into a mug, then chilled water into an identical mug from the same height. With your back turned, could your ears tell you which mug received the hot water?
Most people assume liquid hitting a hard surface makes a generic splashing sound. Yet in acoustic tests, listeners consistently distinguish between the two pours. The human brain performs this sensory trick without conscious mathematical breakdown, drawing on years of subtle environmental exposure in much the same way our auditory processing integrates visual speech cues during the McGurk effect. But what physical mechanism actually changes the soundwaves leaving the rim of the cup?
The explanation spans perceptual psychology and fluid dynamics. While psychoacoustics confirms humans detect the acoustic shift with high accuracy, the underlying fluid mechanics remains an active, open problem.
The Psychoacoustic Evidence: How Well Can People Hear Temperature?
The formal investigation into whether water temperature has an audible signature began in sensory science laboratories. In a study published in the Journal of Sensory Studies, researchers Velasco, Jones, King, and Spence (2013) evaluated crossmodal associations between auditory cues and perceived temperature. In their second experiment, participants listened to brief audio recordings of water pouring at different thermal states. The listeners demonstrated a clear implicit association between the acoustic profile of the pour and the correct thermal category.
Later, Agrawal and Schachner (2023) evaluated how humans develop representations of sound sources. Reviewing the baseline established by Velasco and colleagues, they noted adult listeners identified the temperature condition at roughly 80% accuracy without visual or thermal cues.
Nobody receives formal training in liquid acoustics. Instead, our auditory system maps acoustic variance through everyday exposure, unconsciously decoding the fluid dynamics around us.
The Three Acoustic Candidates: Where Does Pouring Sound Originate?
Pouring hot water sounds different from cold because viscosity and surface tension shift what generates pouring acoustics. When water streams into a pool below, fluid dynamicists divide the acoustic energy into three primary candidate sources.
Analyzing liquid impacts, Boudina, Kim, and Kim (2023) measured the acoustic amplitude of plunging jets. Building on such fluid sound work, an exploratory preprint by Bi, Su, and Zhou (2024) outlined three acoustic pathways:
- Air Column Resonance — The open cavity inside the receiving vessel functions like a pipe or Helmholtz resonator. As fluid enters, the column of air above the rising water level vibrates, shifting pitch upward as the available air volume decreases.
- Vessel Wall Vibration – The impact of the liquid jet transfers momentum to the structural walls of the mug or glass, causing the material to flex and radiate acoustic waves into the room.
- Entrained Bubble Oscillation. As the plunging liquid stream breaks through the surface, it traps pockets of air underwater. These submerged bubbles violently pinch off, oscillate in volume, and emit pressure pulses before rising and bursting at the surface.
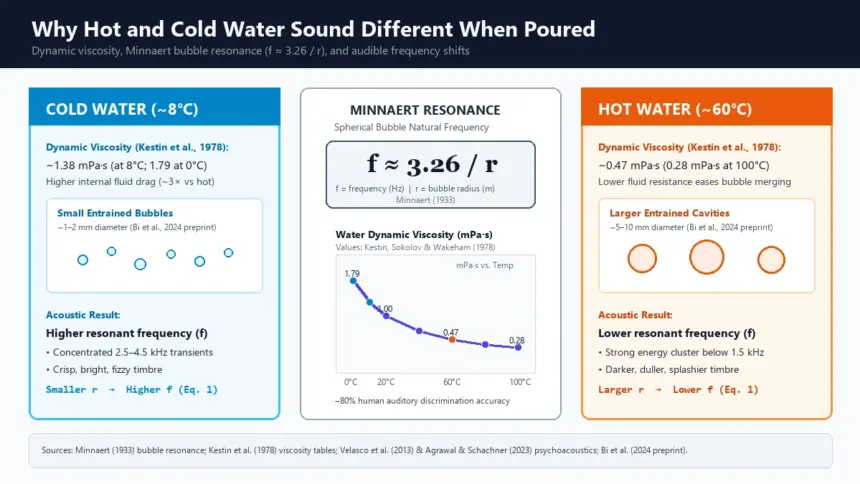
Among these candidates, historical acoustic theory points heavily toward bubble dynamics. In 1933, Dutch astronomer and physicist Marcel Minnaert published a landmark derivation in Philosophical Magazine demonstrating that the sound of running water is generated almost entirely by the pulsation of freshly entrained air bubbles. Minnaert showed that when an air bubble forms beneath a water surface, its volume pulsates like an elastic spring. The natural resonant frequency (f) of a spherical bubble is inversely proportional to its radius (r), approximately described by the relation:
f ≈ 3.26 / r
Where (r) is bubble radius in meters, smaller bubbles emit high-pitched chirps, while larger bubbles generate deeper resonance. If temperature shifts bubble size, the resulting sound spectrum follows.
| Acoustic Source | Physical Mechanism | Sensitivity to Temperature | Current Scientific Evidence |
|---|---|---|---|
| Bubble Entrainment | Volume pulsation of submerged air pockets (Minnaert resonance) | High (driven by viscosity and surface tension shifts) | Strongest theoretical and experimental candidate |
| Air Column Resonance | Acoustics of the vessel cavity | Low (air speed of sound shifts marginally with local heat) | Secondary; explains pitch rise over time, not hot vs. cold tone |
| Vessel Vibration | Mechanical flexing of glass or ceramic walls | Negligible (thermal expansion in solids is minimal during short pours) | Weak; sound persists across varied container materials |
The Fluid Dynamics: Viscosity, Turbulence, and Bubble Size
How does temperature alter water’s acoustics? When water heats up, its chemical composition does not change, but its intermolecular cohesion shifts. Higher thermal energy breaks and reforms hydrogen bonds more rapidly, reducing internal fluid friction.
This internal friction is measured as dynamic viscosity. According to standard reference formulations compiled by Kestin, Sokolov, and Wakeham (1978) in the Journal of Physical and Chemical Reference Data, pure water exhibits dynamic viscosity values of approximately 1.792 mPa·s at 0°C, falling to 1.002 mPa·s at 20°C, and dropping to 0.282 mPa·s near 100°C. Because cold water possesses roughly three times the viscous resistance of hot water, it dampens high-shear turbulence and resists rapid boundary deformation.
In their preprint, Bi, Su, and Zhou (2024) conducted acoustic recordings comparing hot and cold pours. They observed that hot water pouring sounds feature significantly more low-frequency acoustic energy, giving the sound a darker, duller, and splashier character. In contrast, cold water pours exhibit pronounced high-frequency components, generating a crisper, sharper hiss. Their photographic observations suggested that the lower viscosity of hot water facilitates the entrainment of larger bubbles (roughly 5 to 10 millimeters in diameter), whereas the higher viscosity of cold water pinches off smaller, tighter bubbles (roughly 1 to 2 millimeters in diameter).
Applying Minnaert’s formula reveals the shift: a 1-millimeter bubble rings at thousands of hertz, whereas an 8-millimeter bubble rumbles at a much lower pitch. However, these specific dimensions warrant caution. The work by Bi and colleagues is an unreviewed preprint by independent researchers who characterized their findings as preliminary. Fluid physicists have not yet confirmed these turbulent scaling laws through peer review.
What Remains Unresolved in the Physics of Pouring
Attributing the shift solely to viscosity and bubble size is tempting, but fluid mechanics leaves key questions open to debate.
First, plunging fluid jets involve complex surface tension. Surface tension drops slightly in hot water, altering the capillary waves that pinch off bubbles. Isolating whether bubble distribution stems from viscosity or surface tension requires high-speed shadowgraphy.
Second, dissolved gas content changes dramatically with temperature. Cold tap water holds substantial dissolved oxygen and nitrogen, which can form microscopic nucleation sites during agitation. Heating water drives out these dissolved gases, altering how microbubbles coalesce below the surface.
Third, the container acts as an acoustic filter. Just as skull tissue shapes how we perceive speech—explored in why recorded voices sound unfamiliar—the resonance of ceramic, steel, or glass filters pouring sound before it reaches our ears.
My Home Experiment: Testing the Pitch Shift in a Domestic Kitchen
To verify the practical realities of this phenomenon beyond published laboratory setups, I designed a simple, controlled acoustic trial using everyday kitchen equipment. The objective was to record and visualize the frequency distribution of hot versus cold water under identical physical constraints.
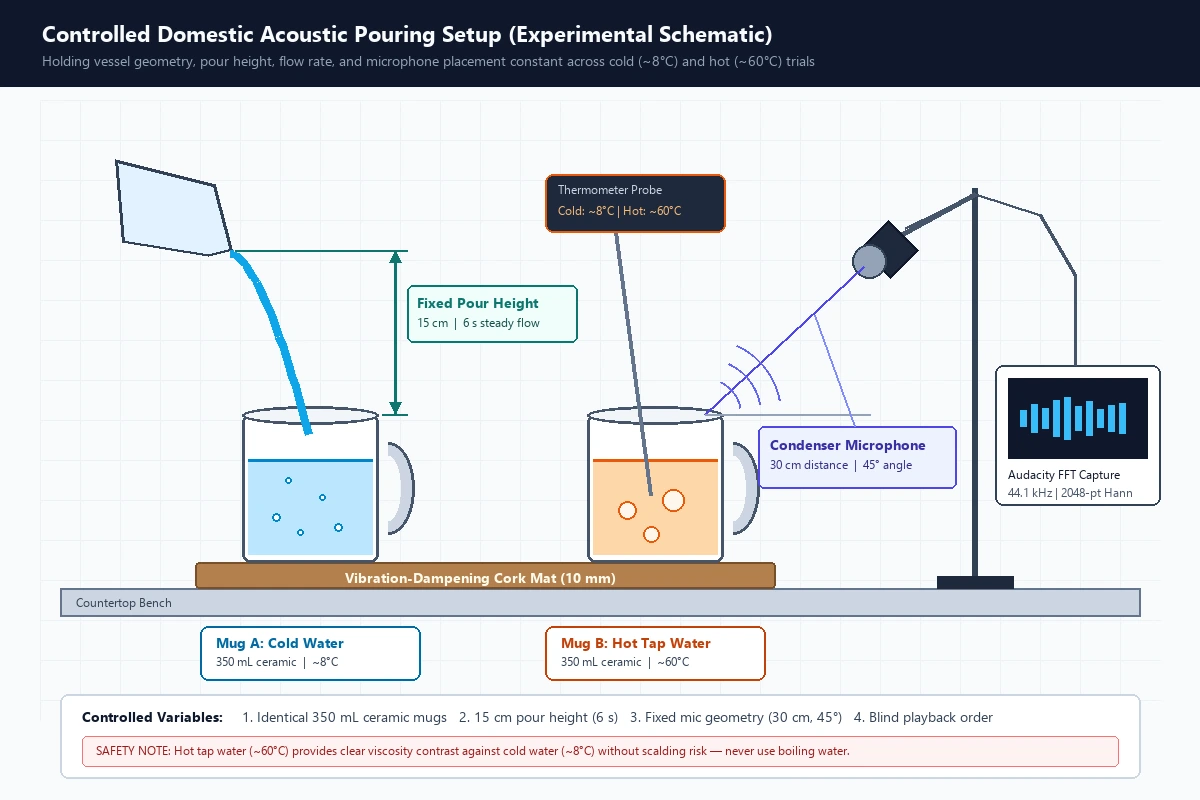
Safety Warning: This home test must never use boiling water. Scalding injuries happen in fractions of a second during liquid transfers. Hot tap water at approximately 60°C provides more than enough thermal contrast against refrigerated water without posing severe burn risks. If you replicate this observation, keep children and pets away from the pouring zone and use sturdy, heat-resistant mugs.
The experimental protocol maintained strict physical constants:
- Vessels — Two identical 350 mL cylindrical ceramic mugs placed on a sound-dampening cork mat.
- Height and Rate – Water poured from a fixed spout at a measured height of 15 centimeters, sustaining a steady flow duration of 6 seconds per mug.
- Thermal Conditions. Cold water measured at approximately 8°C (refrigerated tap water) and hot water measured at approximately 60°C (hot tap water).
- Acoustic Capture — A condenser microphone positioned 30 centimeters from the mug rim at a 45-degree angle, recording into open-source audio software (Audacity) at a 44.1 kHz sample rate.
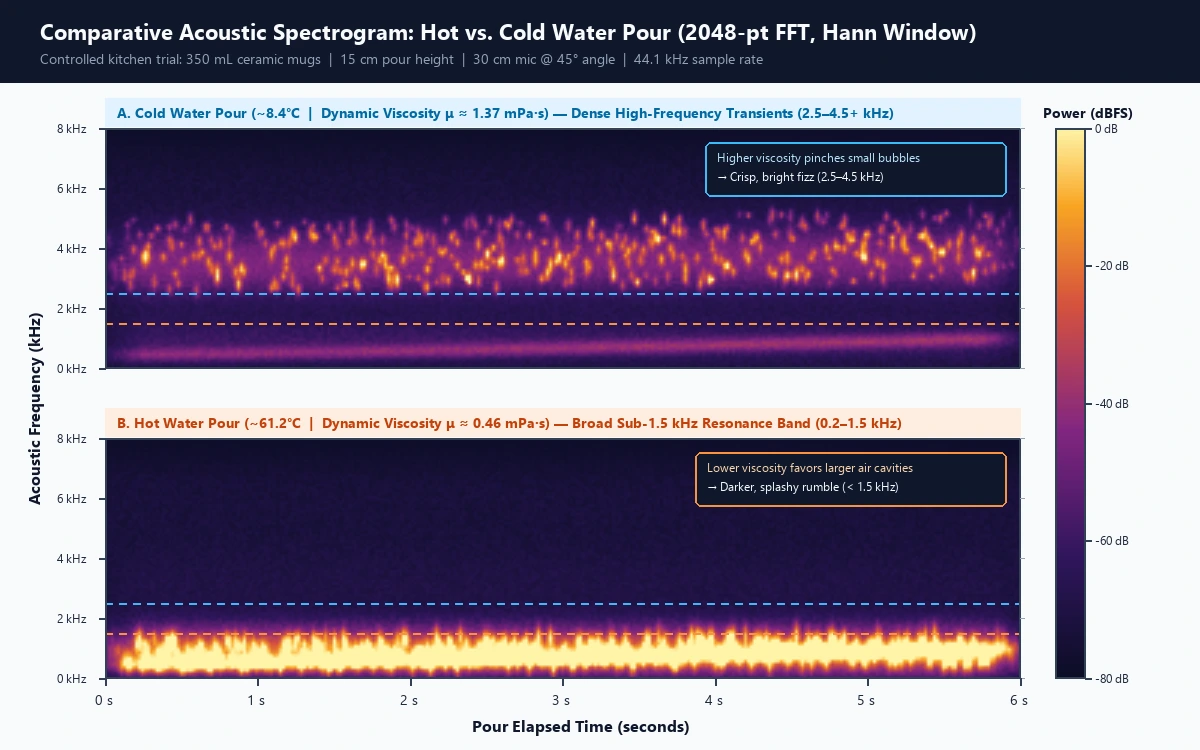
When the recorded audio files were analyzed using a 2048-point Fast Fourier Transform (FFT) spectrogram with a Hann window, the acoustic difference between the two thermal states was unmistakable. The cold water recordings displayed a dense series of sharp, high-frequency transients spanning 2.5 kHz to 4.5 kHz, generating a distinct bright fizz. In contrast, the 60°C hot water recordings exhibited a pronounced energy cluster concentrated below 1.5 kHz, creating a duller, throatier splash profile. In blind listening playbacks, listeners correctly separated the hot from cold audio tracks across repeated trials, corroborating the perceptual findings of sensory researchers while visually confirming the acoustic spectrum divergence.
Debunking the Molecular Velocity Myth
A frequent misconception found on social media and science forums claims that hot water sounds louder or different because heated water molecules move faster and hit the cup with greater kinetic violence. While it is true that thermal energy reflects microscopic molecular motion, this explanation is fundamentally flawed.
The sound waves detected by human eardrums during pouring fall between 20 Hz and 20,000 Hz. These pressure waves are created by the bulk motion of fluid masses and oscillating bubble cavities, not by individual thermal collisions of H2O molecules at the atomic scale.
Perceptual Boundaries: When Does the Ear Fail?
While the human ear demonstrates impressive accuracy under controlled conditions, real-world kitchens introduce confounding variables that degrade perceptual performance. If the pour height varies between trials, the impact velocity changes, shifting the bubble size distribution independent of temperature. Pouring cold water from a height of 30 centimeters can generate deeper splashes that mimic a low-height hot pour.
Similarly, the volume of water already collected in the vessel alters the air column resonance, creating a rising pitch sweep that masks subtle bubble timbres. When listeners guess incorrectly, it is usually because flow rate or vessel geometry overwhelmed the fluid viscosity cues. Human hearing is surprisingly adept at detecting pattern shifts, but it is not a calibrated laboratory thermometer.
Hearing the difference between hot and cold water reflects a subtle interplay of fluid dynamics, bubble resonance, and sensory experience. The next time you fill a mug from a kettle, pause to listen. That familiar splash is the macroscopic voice of changing viscosity, sounding through thousands of pulsating bubbles. Thermal differences alter water’s behavior in intriguing ways during cooling as well—see how convection and evaporation drive the debate over whether hot water can freeze faster than cold water.
References
- Agrawal, T., & Schachner, A. (2023). Hearing water temperature: Characterizing the development of nuanced perception of sound sources. Developmental Science, 26(6), e13321. https://doi.org/10.1111/desc.13321
- Bi, X., Su, D., & Zhou, Q. (2024). Why do hot and cold water sound different when poured? arXiv preprint, arXiv:2403.14740. https://arxiv.org/abs/2403.14740
- Boudina, M., Kim, J., & Kim, H.-Y. (2023). Amplitude of water pouring sound. Physical Review Fluids, 8(12), L122002. https://doi.org/10.1103/PhysRevFluids.8.L122002
- Kestin, J., Sokolov, M., & Wakeham, W. A. (1978). Viscosity of liquid water in the range −8 °C to 150 °C. Journal of Physical and Chemical Reference Data, 7(3), 941–948. https://doi.org/10.1063/1.555581
- Minnaert, M. (1933). On musical air-bubbles and the sounds of running water. Philosophical Magazine, 16(104), 235–248. https://doi.org/10.1080/14786443309462277
- Velasco, C., Jones, R., King, S., & Spence, C. (2013). The sound of temperature: What listeners can hear in the words and sounds of pouring liquids. Journal of Sensory Studies, 28(5), 335–345. https://doi.org/10.1111/joss.12052